Multidimensional poverty index MPI
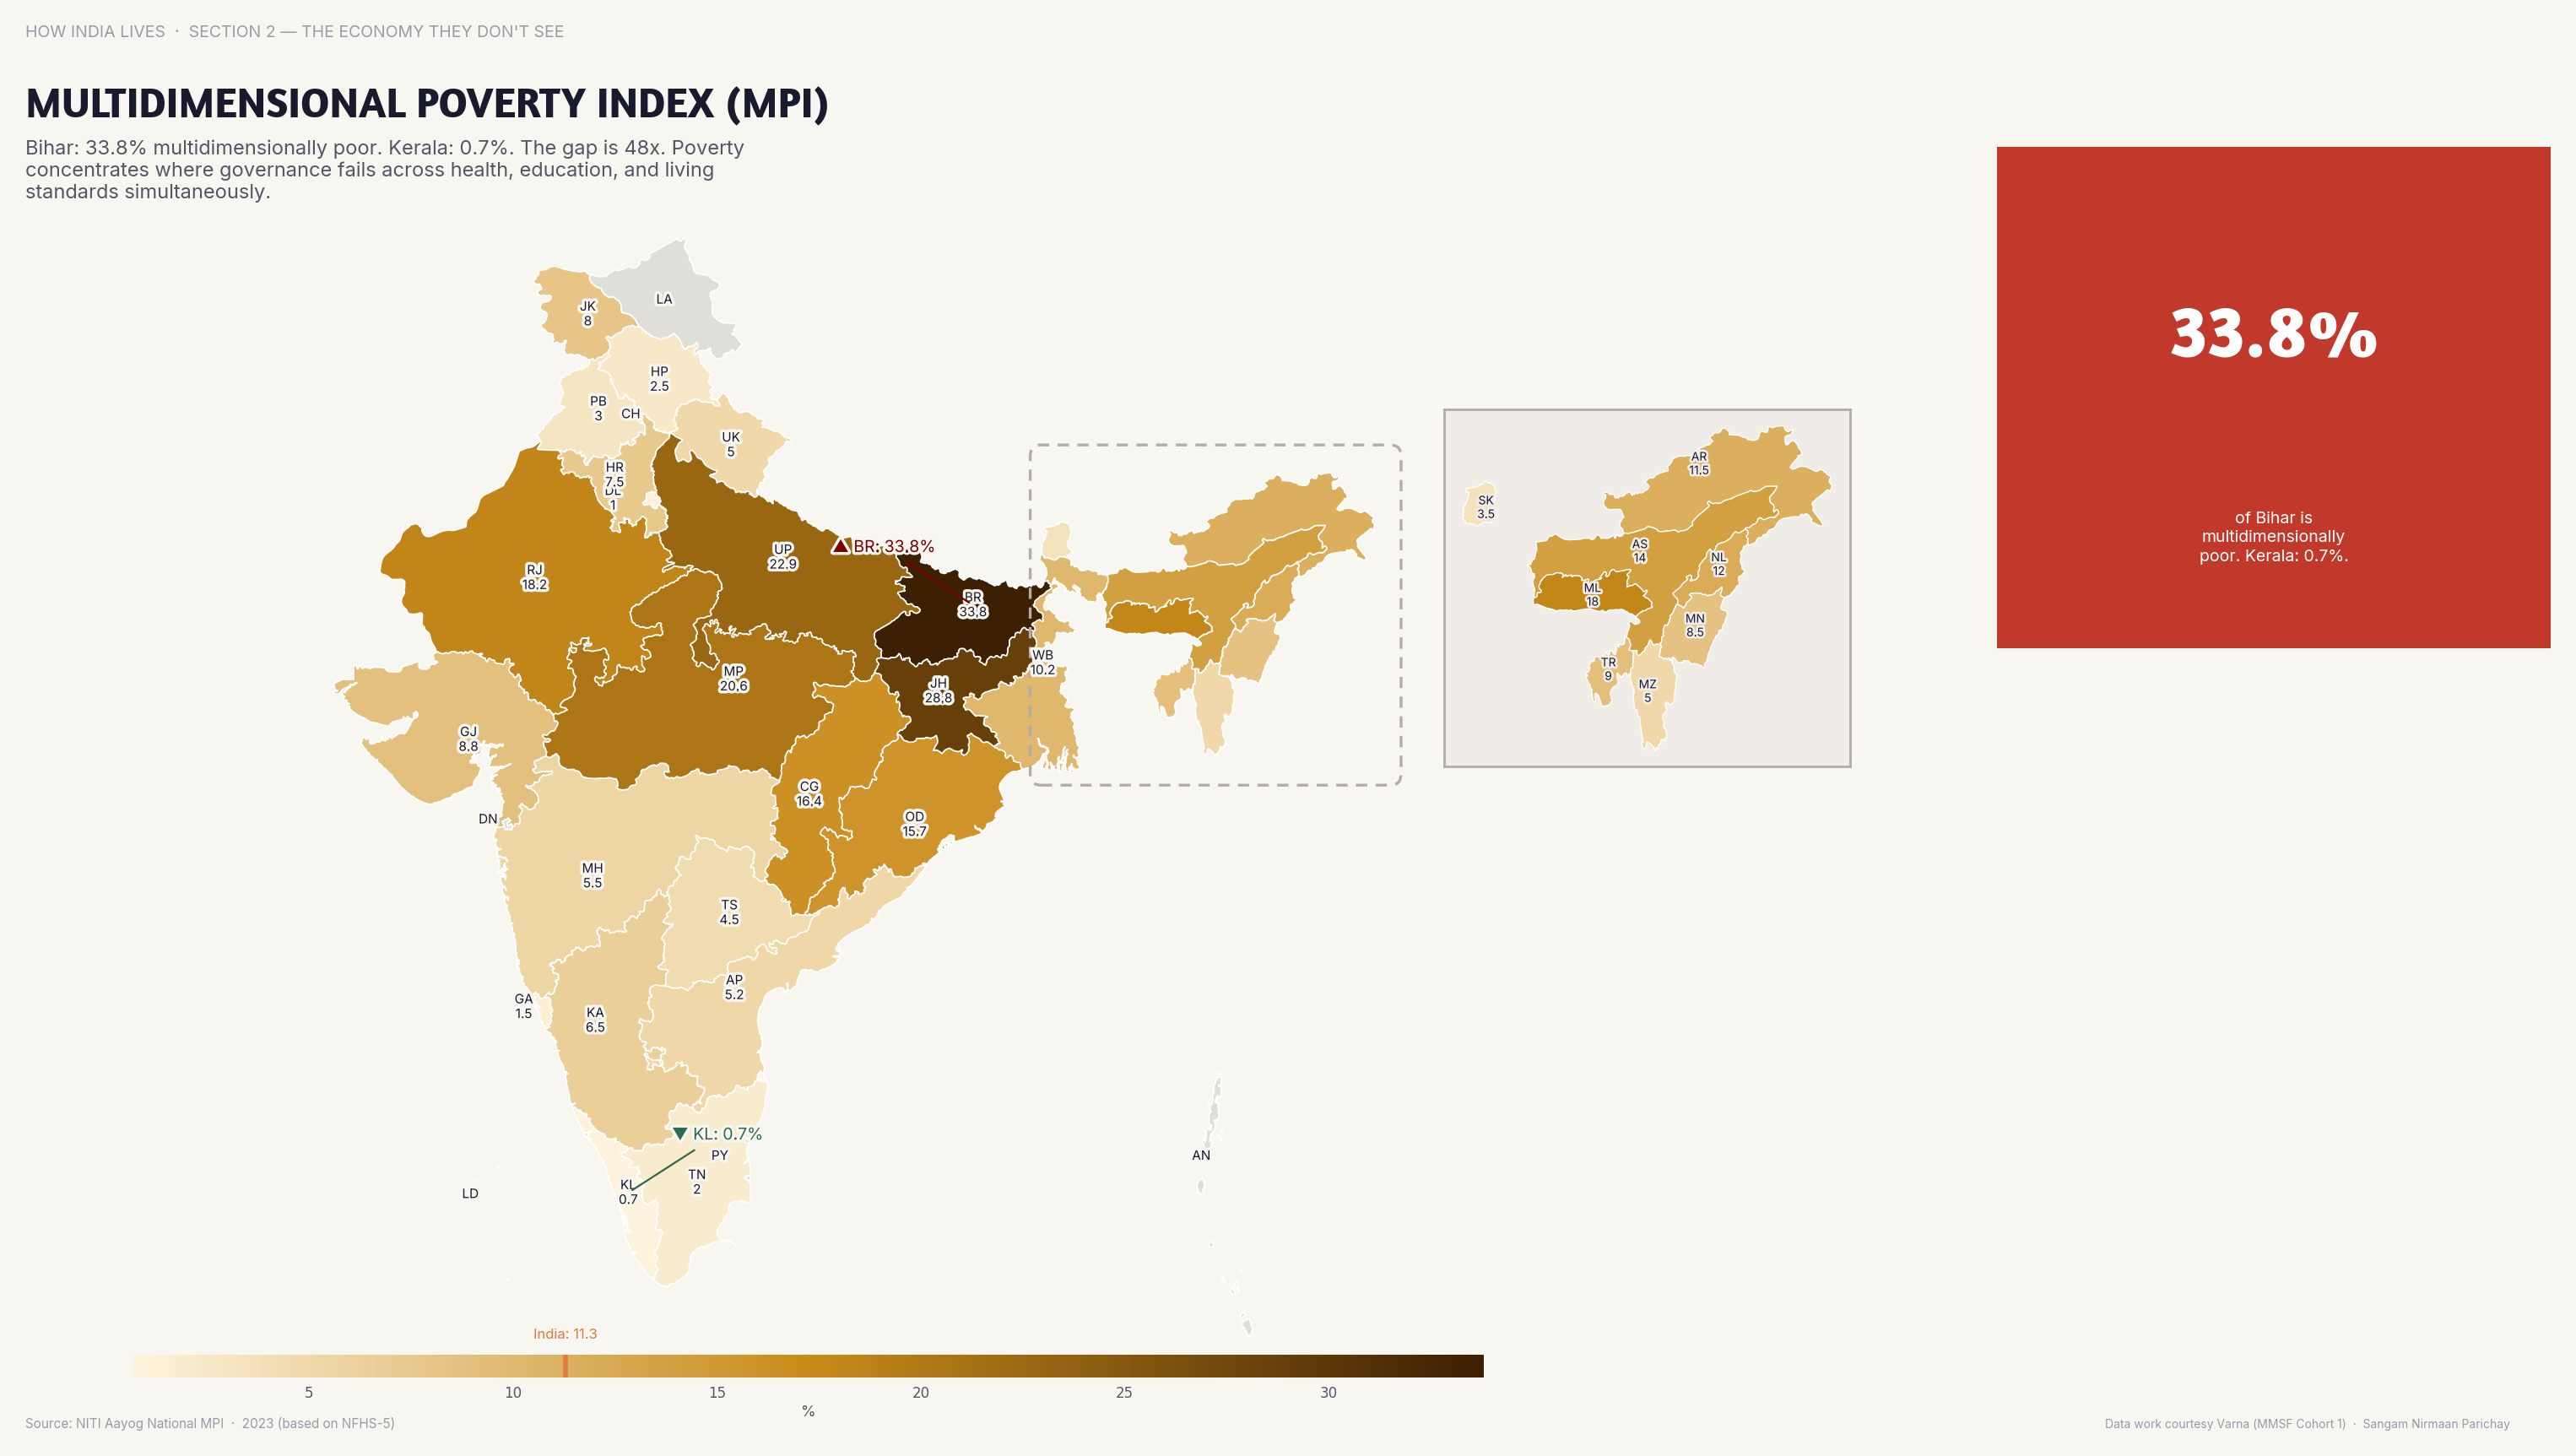
Bihar's MPI is 0.35; Kerala's is 0.01, a 35x gap in multidimensional poverty within one country.
Policy implication
The MPI shows poverty compounding across health, education, and living standards at once, well beyond income.
The MPI shows poverty compounding across health, education, and living standards at once, well beyond income.
Data vintage. The figures are for 2022-23 and have not been refreshed since this map was made.
Source: RBI/MoSPI (2022-23). See the methodology for notes and limitations.
Part of ImpactMojo. Maps are pedagogical tools for facilitated discussion. For figures to cite, use the source publications. CC BY-NC-SA 4.0.