MGNREGA average days of work per household
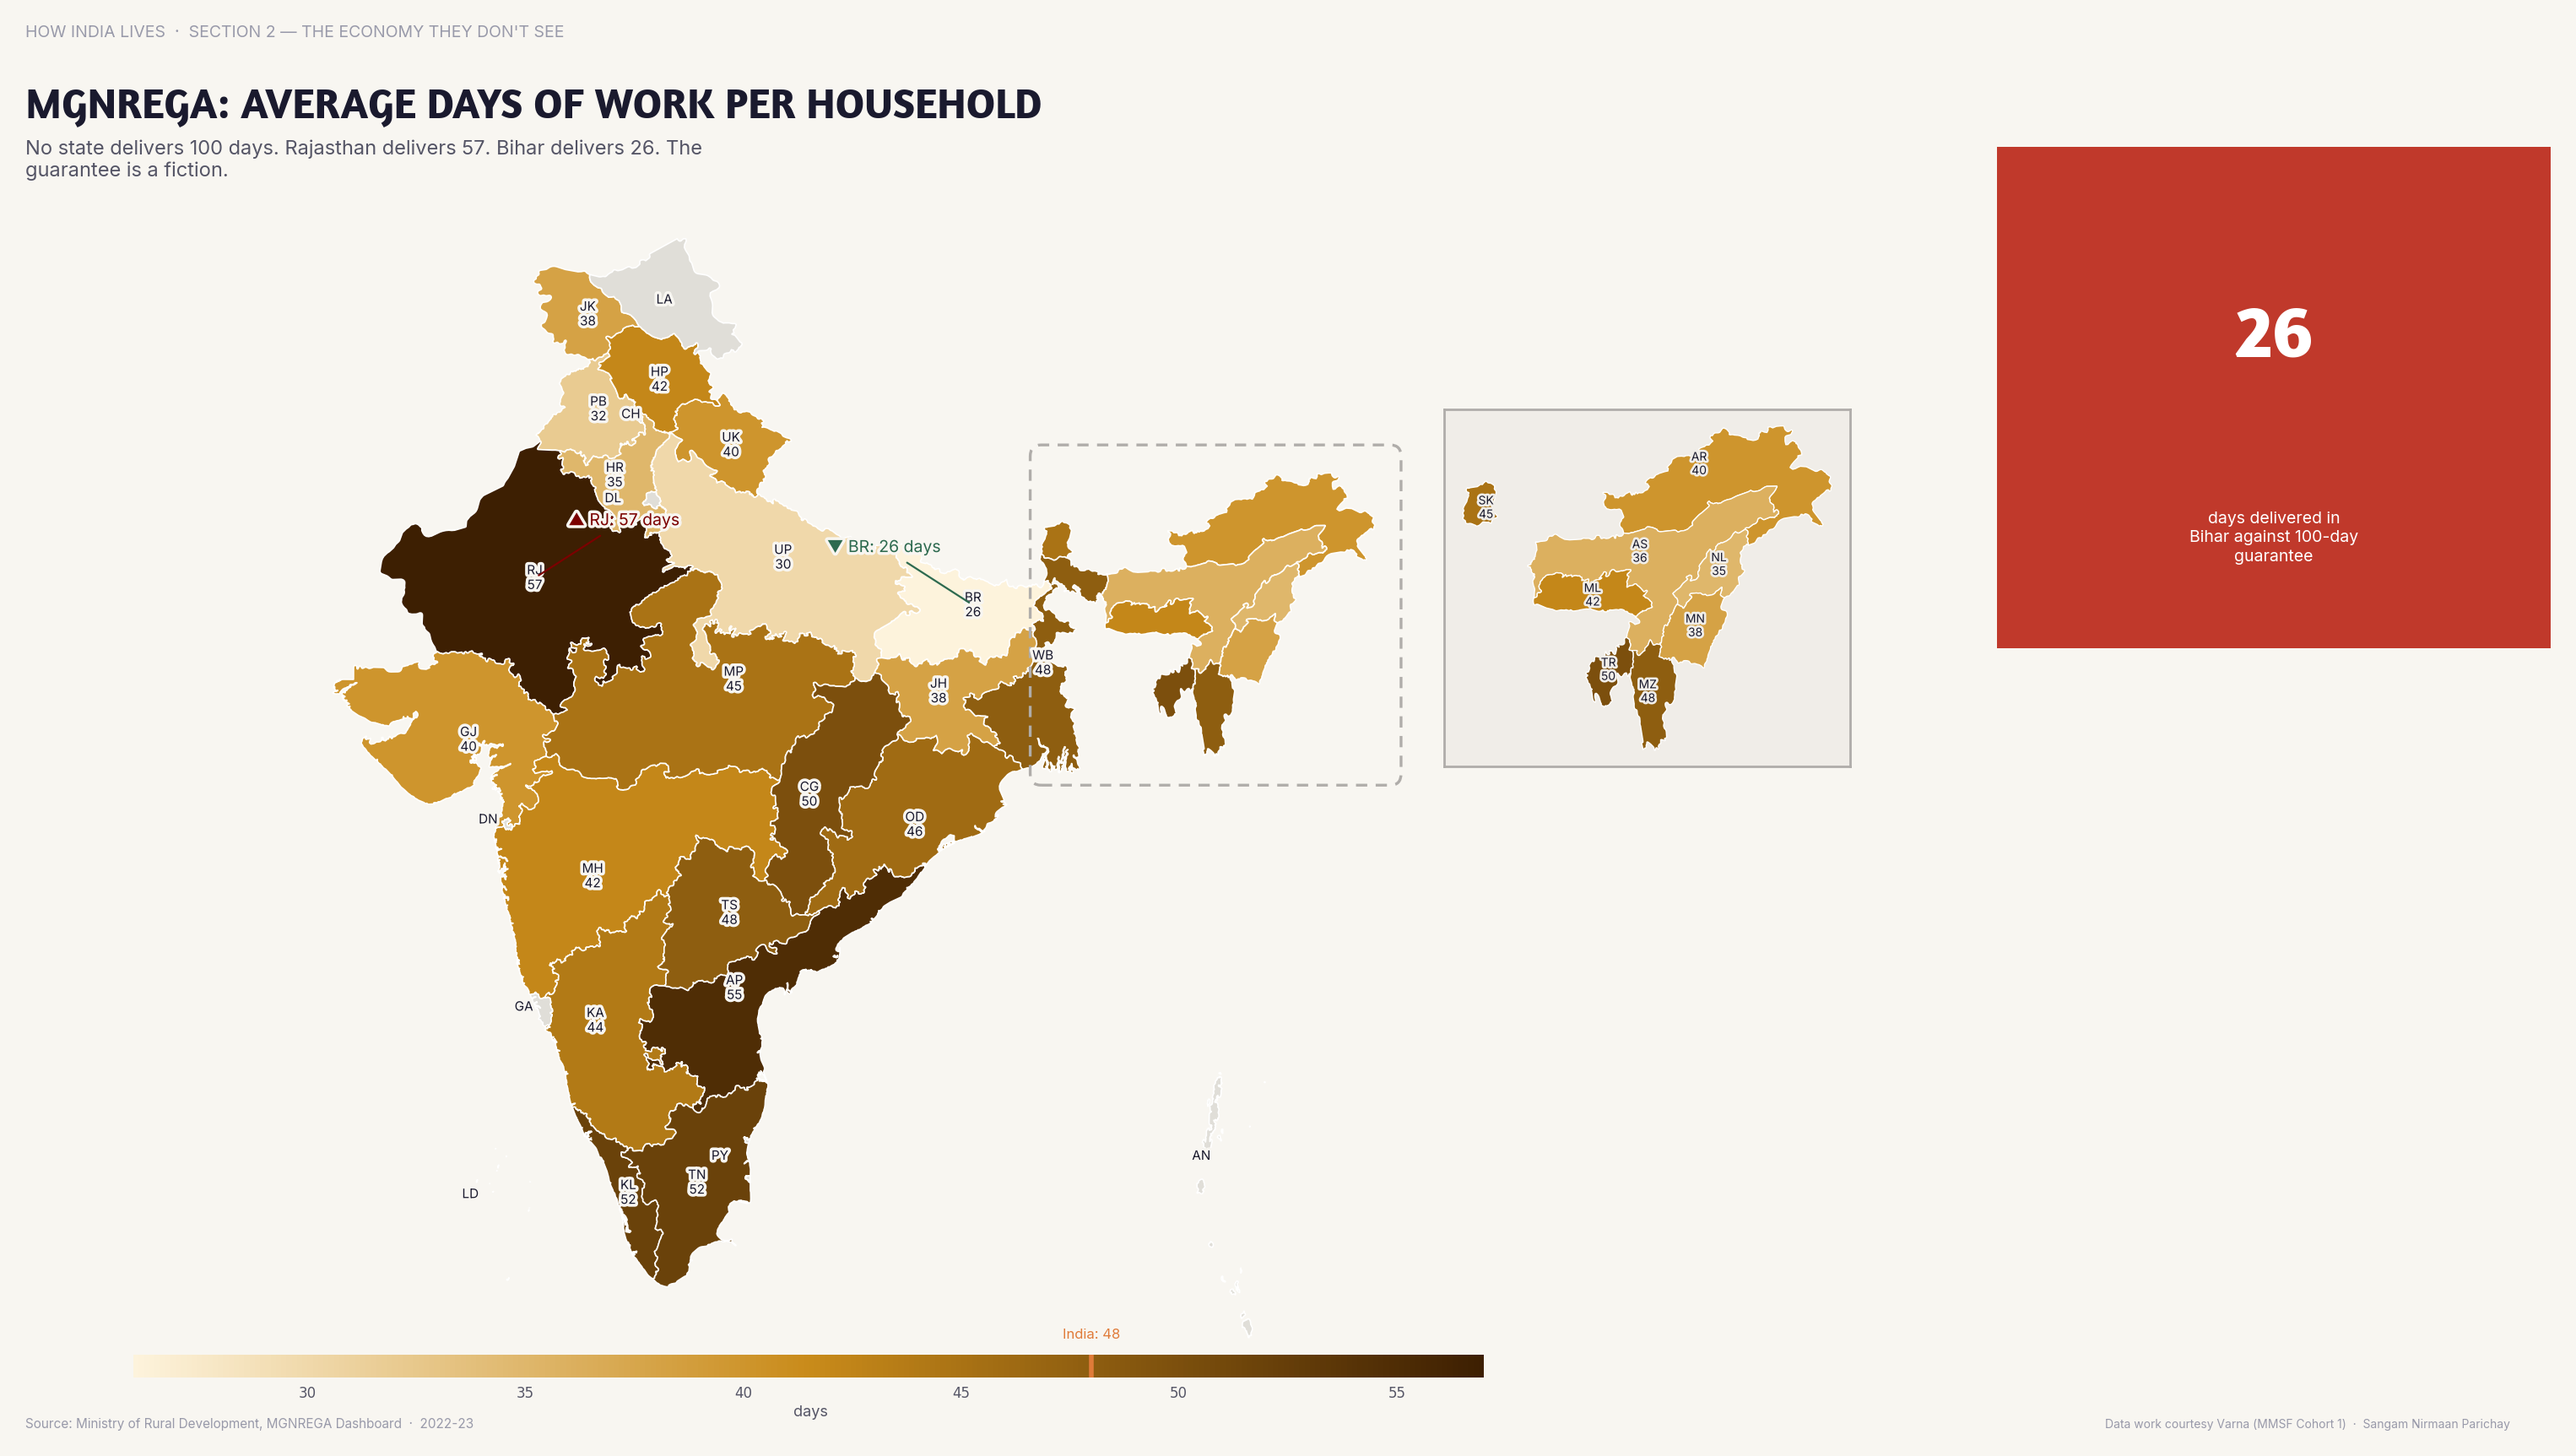
Tamil Nadu provides 50+ days of MGNREGA work per household; Bihar provides under 30.
Policy implication
MGNREGA is demand-driven in theory but supply-constrained in practice. Poorer states deliver fewer days.
MGNREGA is demand-driven in theory but supply-constrained in practice. Poorer states deliver fewer days.
Data vintage. The figures are for 2023-24 and have not been refreshed since this map was made. See the newer figures for this measure in the interactive atlas.
Source: MoRD (2023-24). See the methodology for notes and limitations.
Part of ImpactMojo. Maps are pedagogical tools for facilitated discussion. For figures to cite, use the source publications. CC BY-NC-SA 4.0.