IUD Copper-T Use Among Married Women
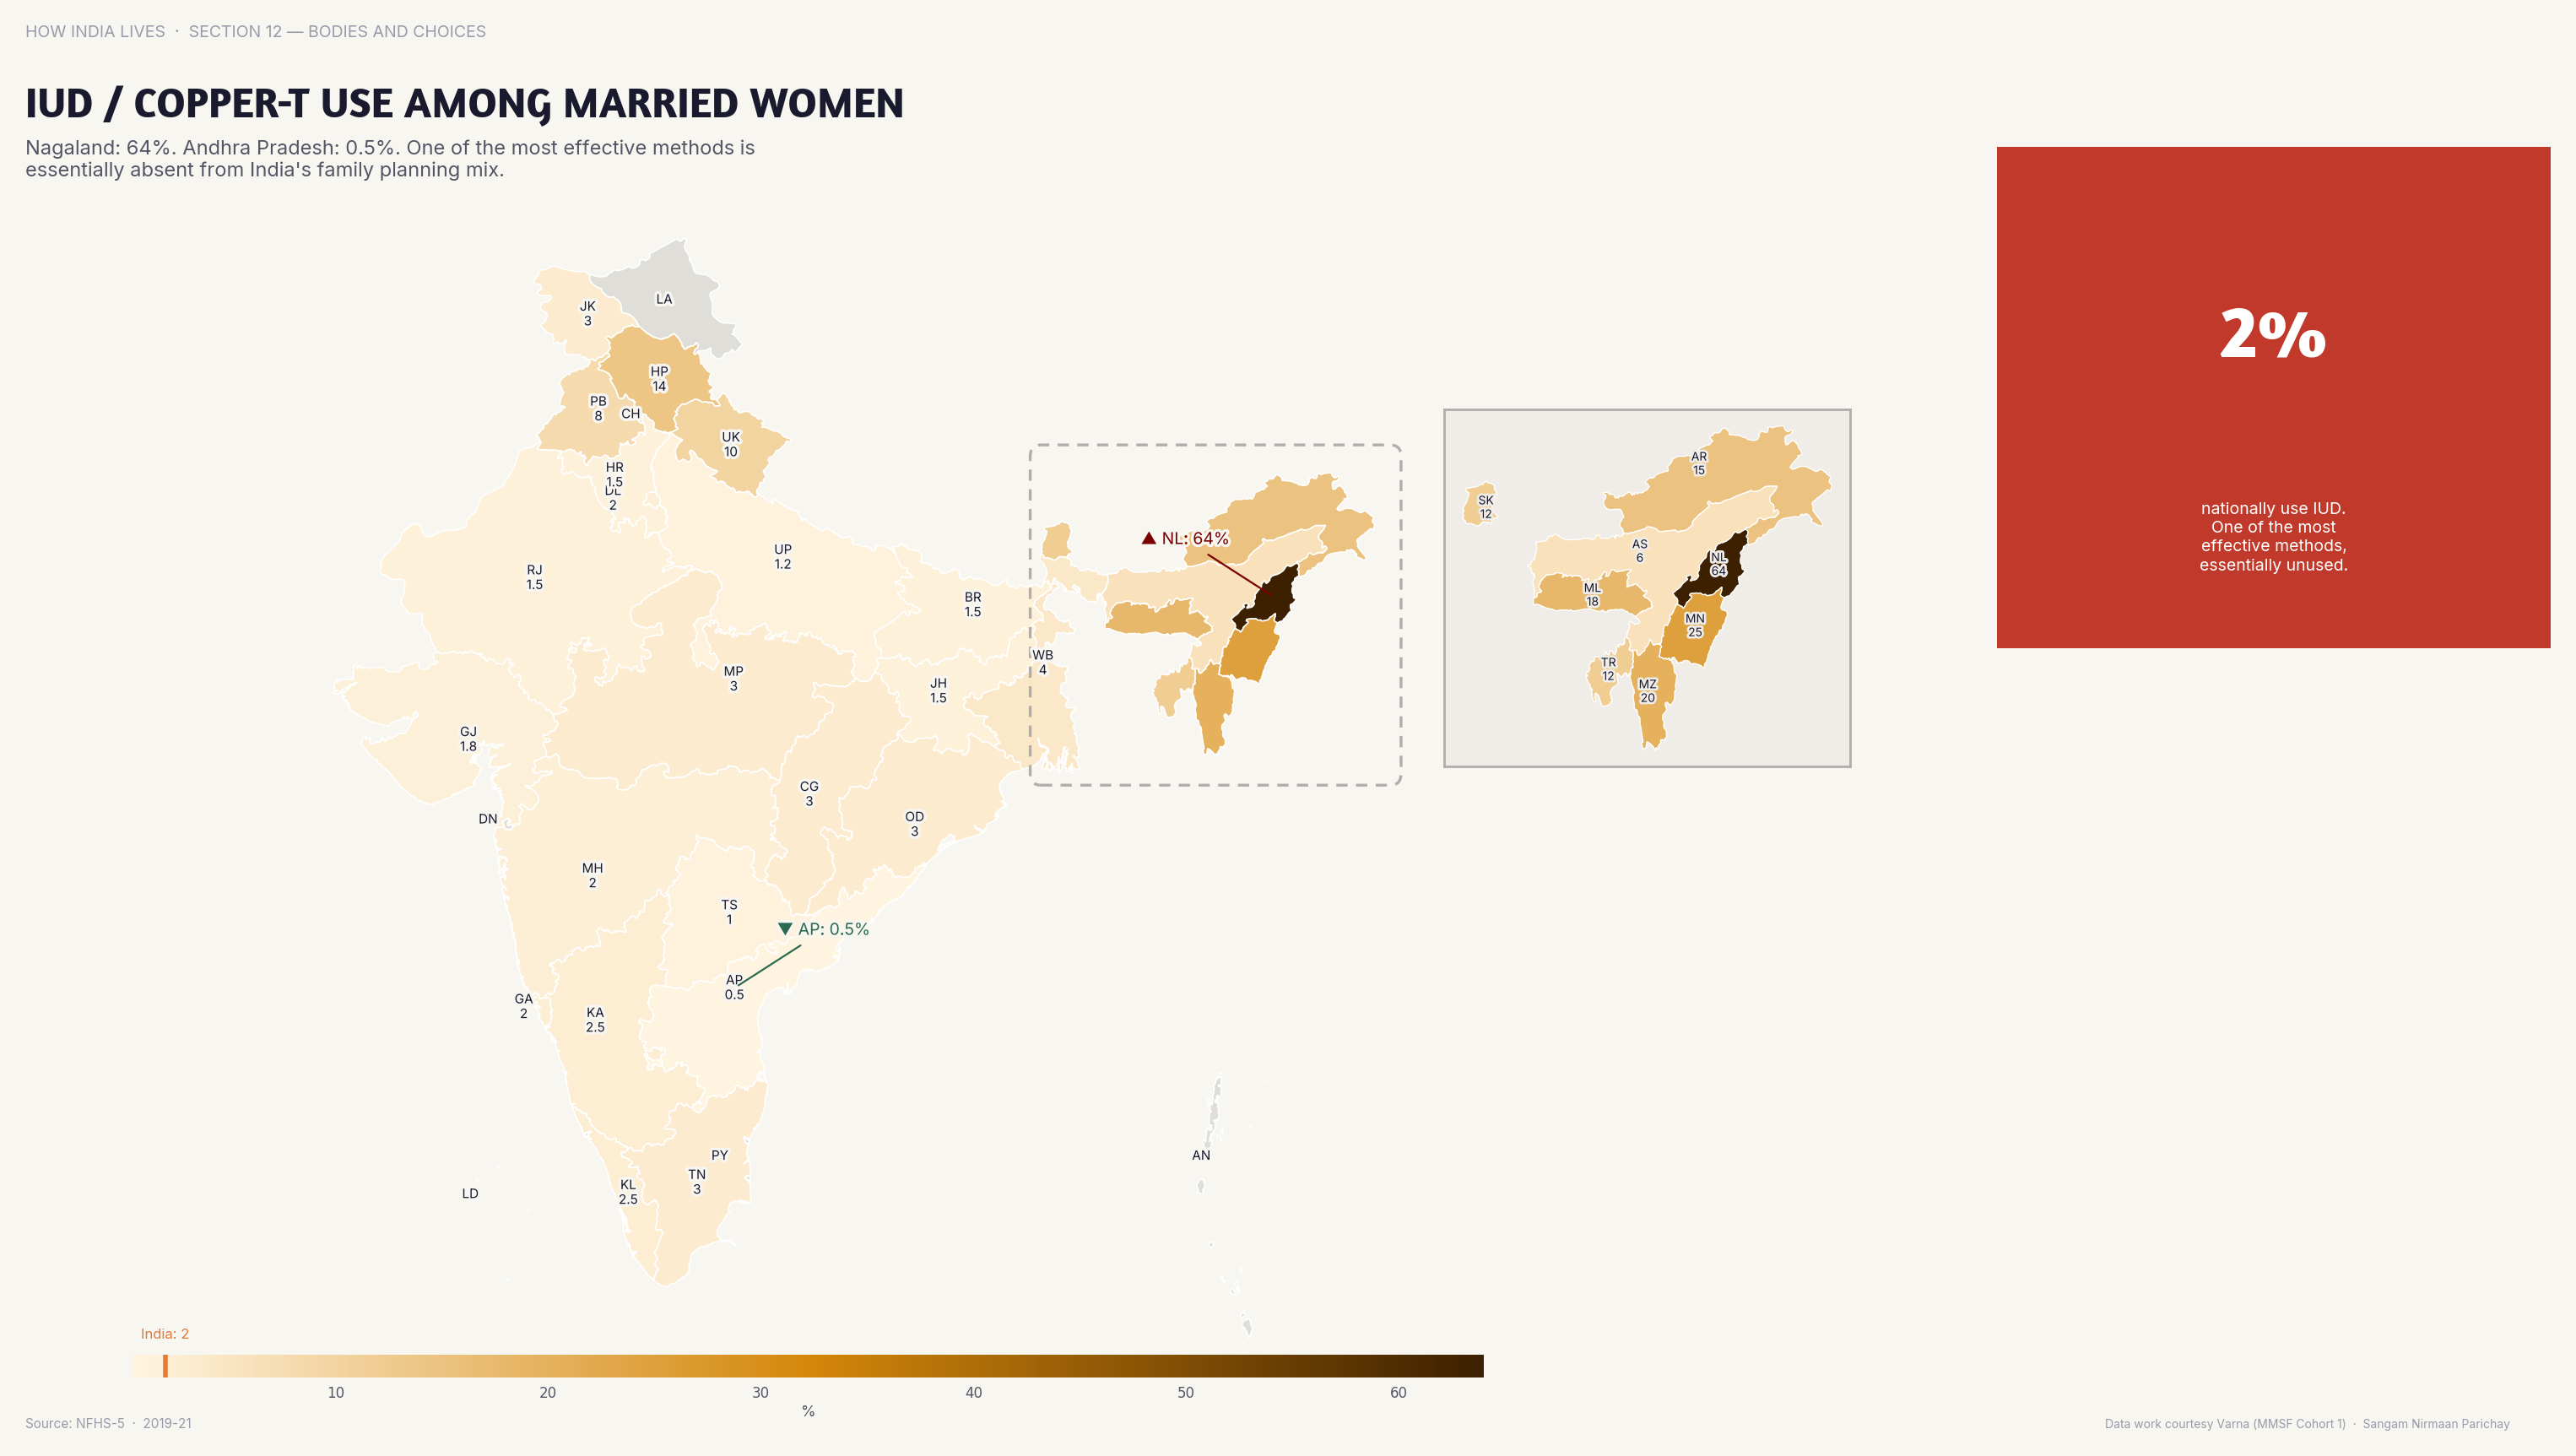
IUD/Copper-T use varies from 2% to 12% — it's high in UP (government push) and low in southern states.
Policy implication
IUD use reflects provider preference more than women's choice — insertion targets drive clinical behaviour.
IUD use reflects provider preference more than women's choice — insertion targets drive clinical behaviour.
Source: NFHS-5 (2019-21). See the methodology for notes and limitations.
Part of ImpactMojo. Maps are pedagogical tools for facilitated discussion, not standalone data references. CC BY-NC-SA 4.0.