Child wasting, NFHS-6
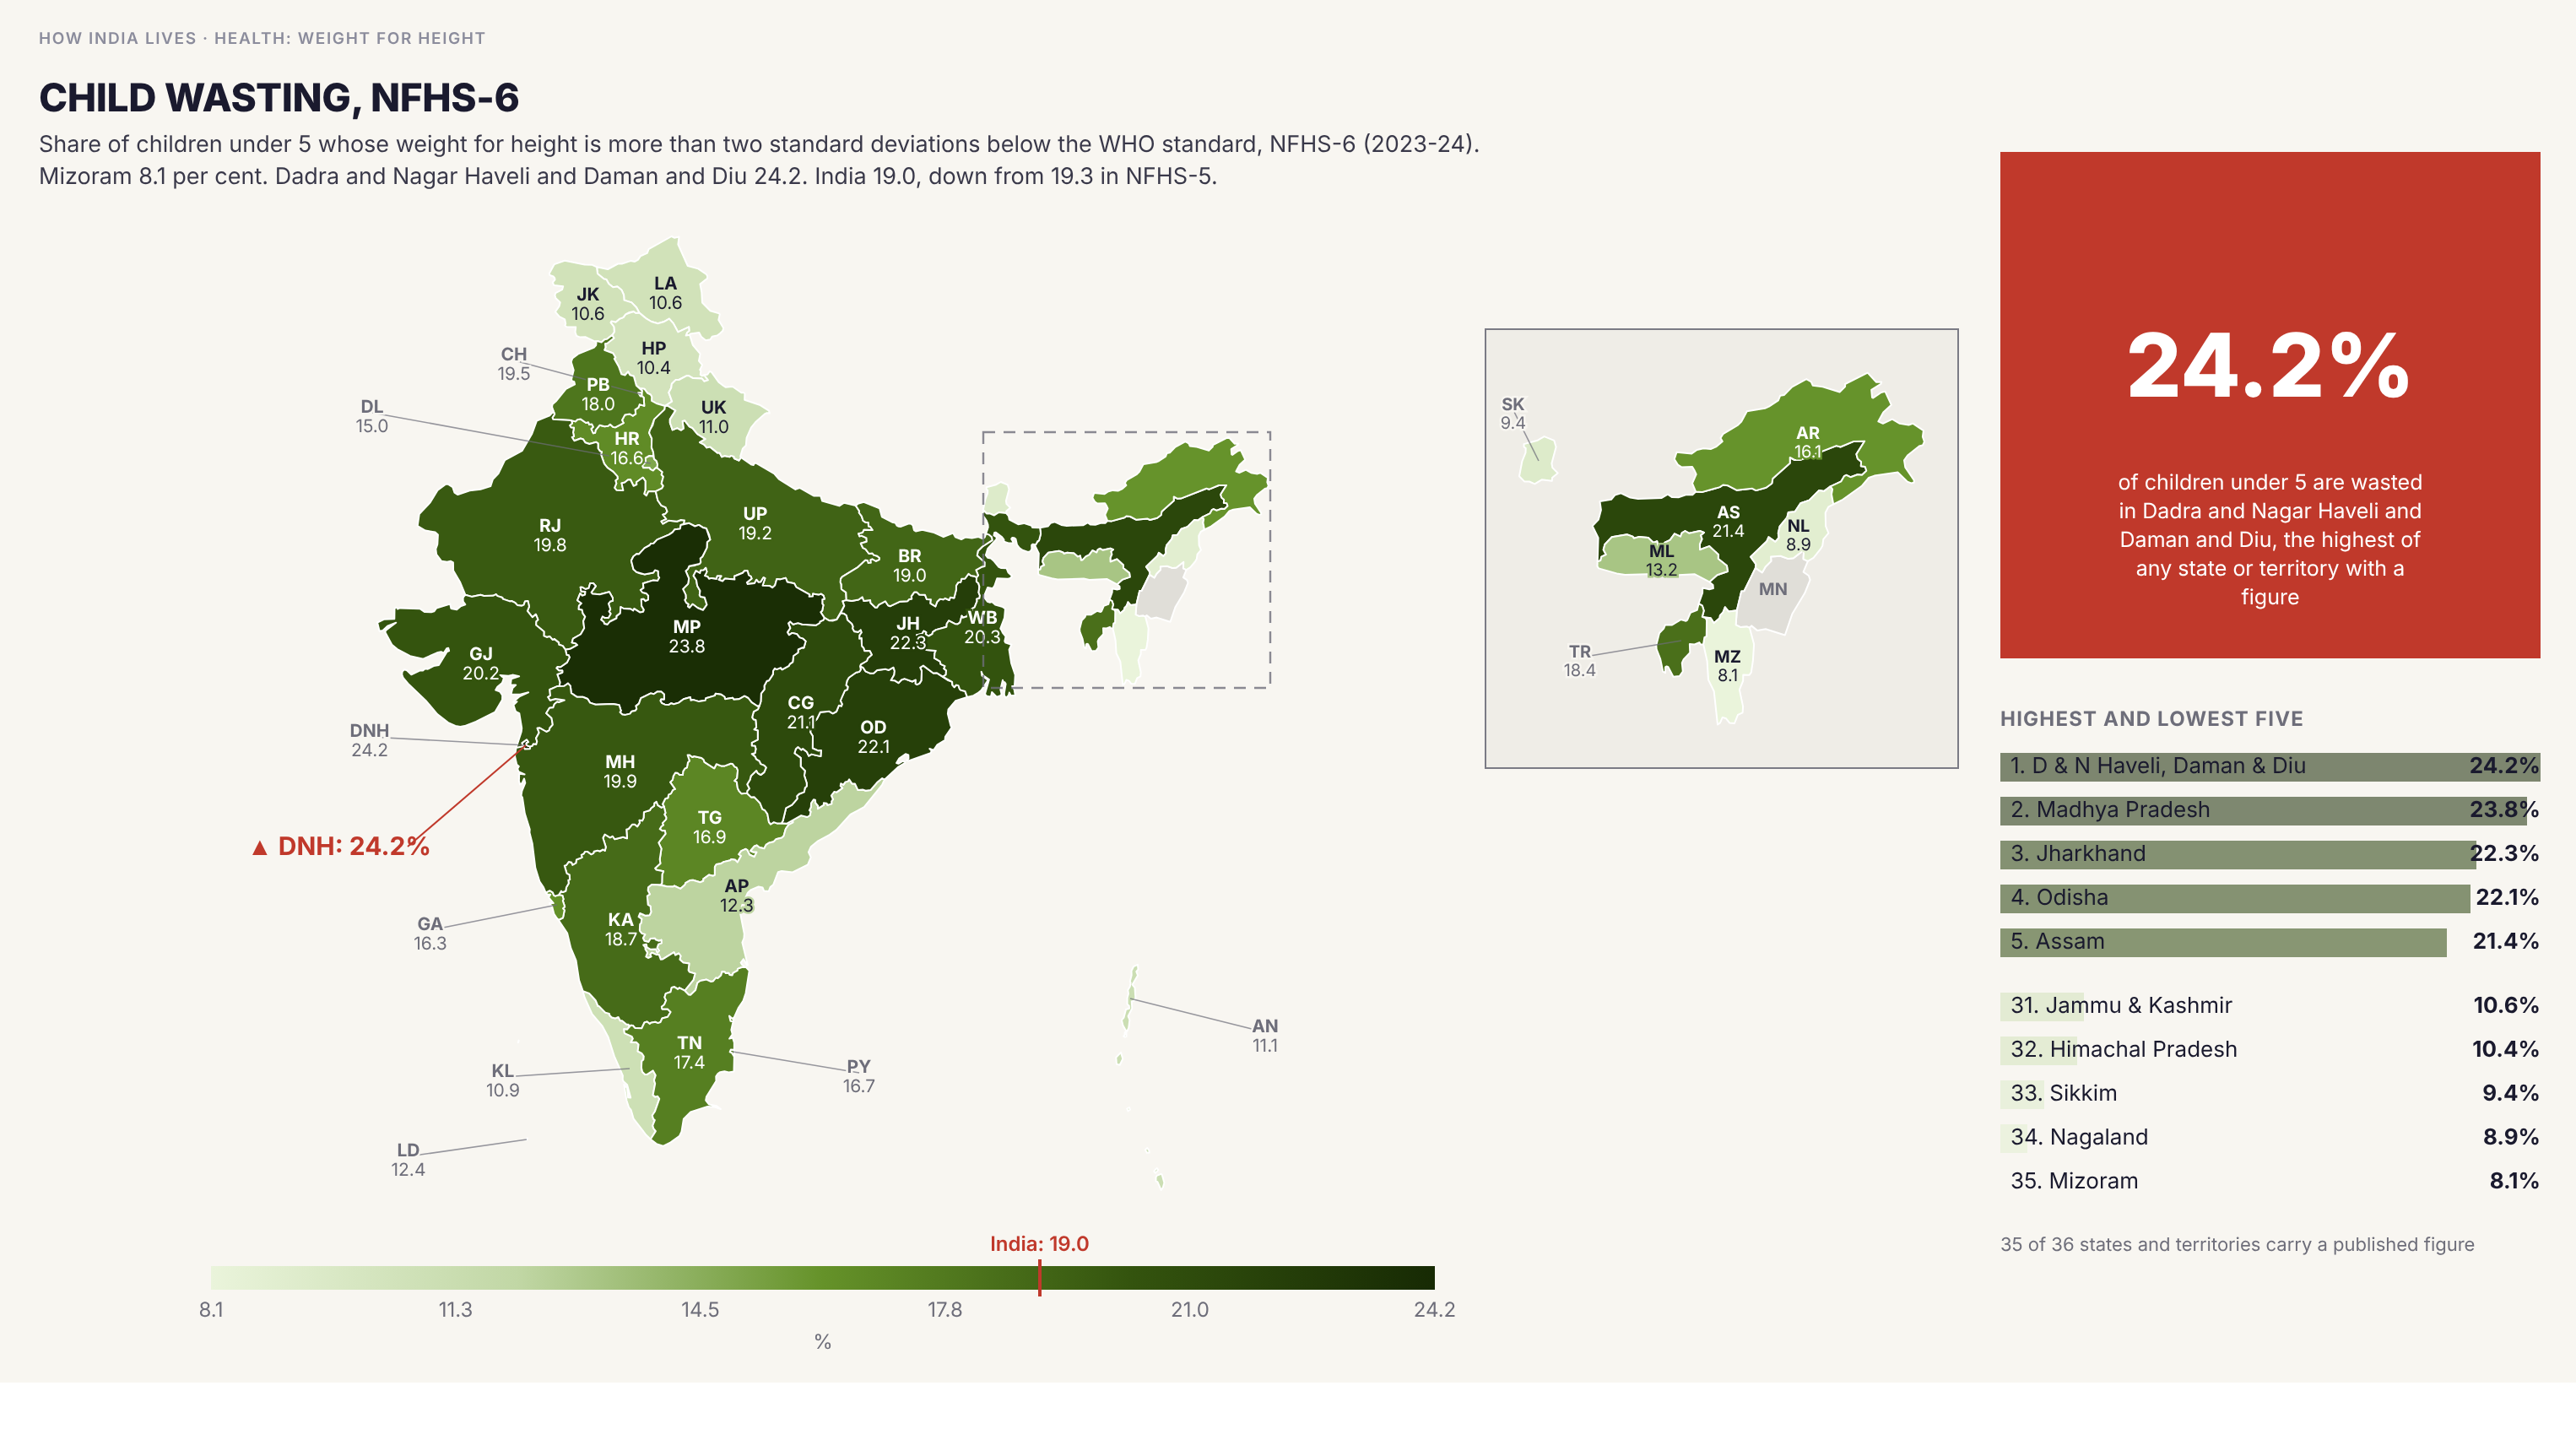
Children under 5 who are wasted ranges from 8.1 per cent in Mizoram to 24.2 per cent in Dadra and Nagar Haveli and Daman and Diu. The India figure is 19.0 per cent, down from 19.3 in NFHS-5.
Policy implication
Wasting reflects recent shortfalls in food and bouts of illness, so it can move faster than stunting. One survey year is not a trend.
Wasting reflects recent shortfalls in food and bouts of illness, so it can move faster than stunting. One survey year is not a trend.
Data vintage. This map uses NFHS-5 (2019-21). NFHS-6 (2023-24) state fact sheets were released in May 2026, but they are provisional and report fewer indicators, so the figures here have not been replaced.
Source: NFHS-6 (2023-24) (2023-24). See the methodology for notes and limitations.
Part of ImpactMojo. Maps are pedagogical tools for facilitated discussion, not standalone data references. CC BY-NC-SA 4.0.