Services share of state output, MoSPI 2024-25
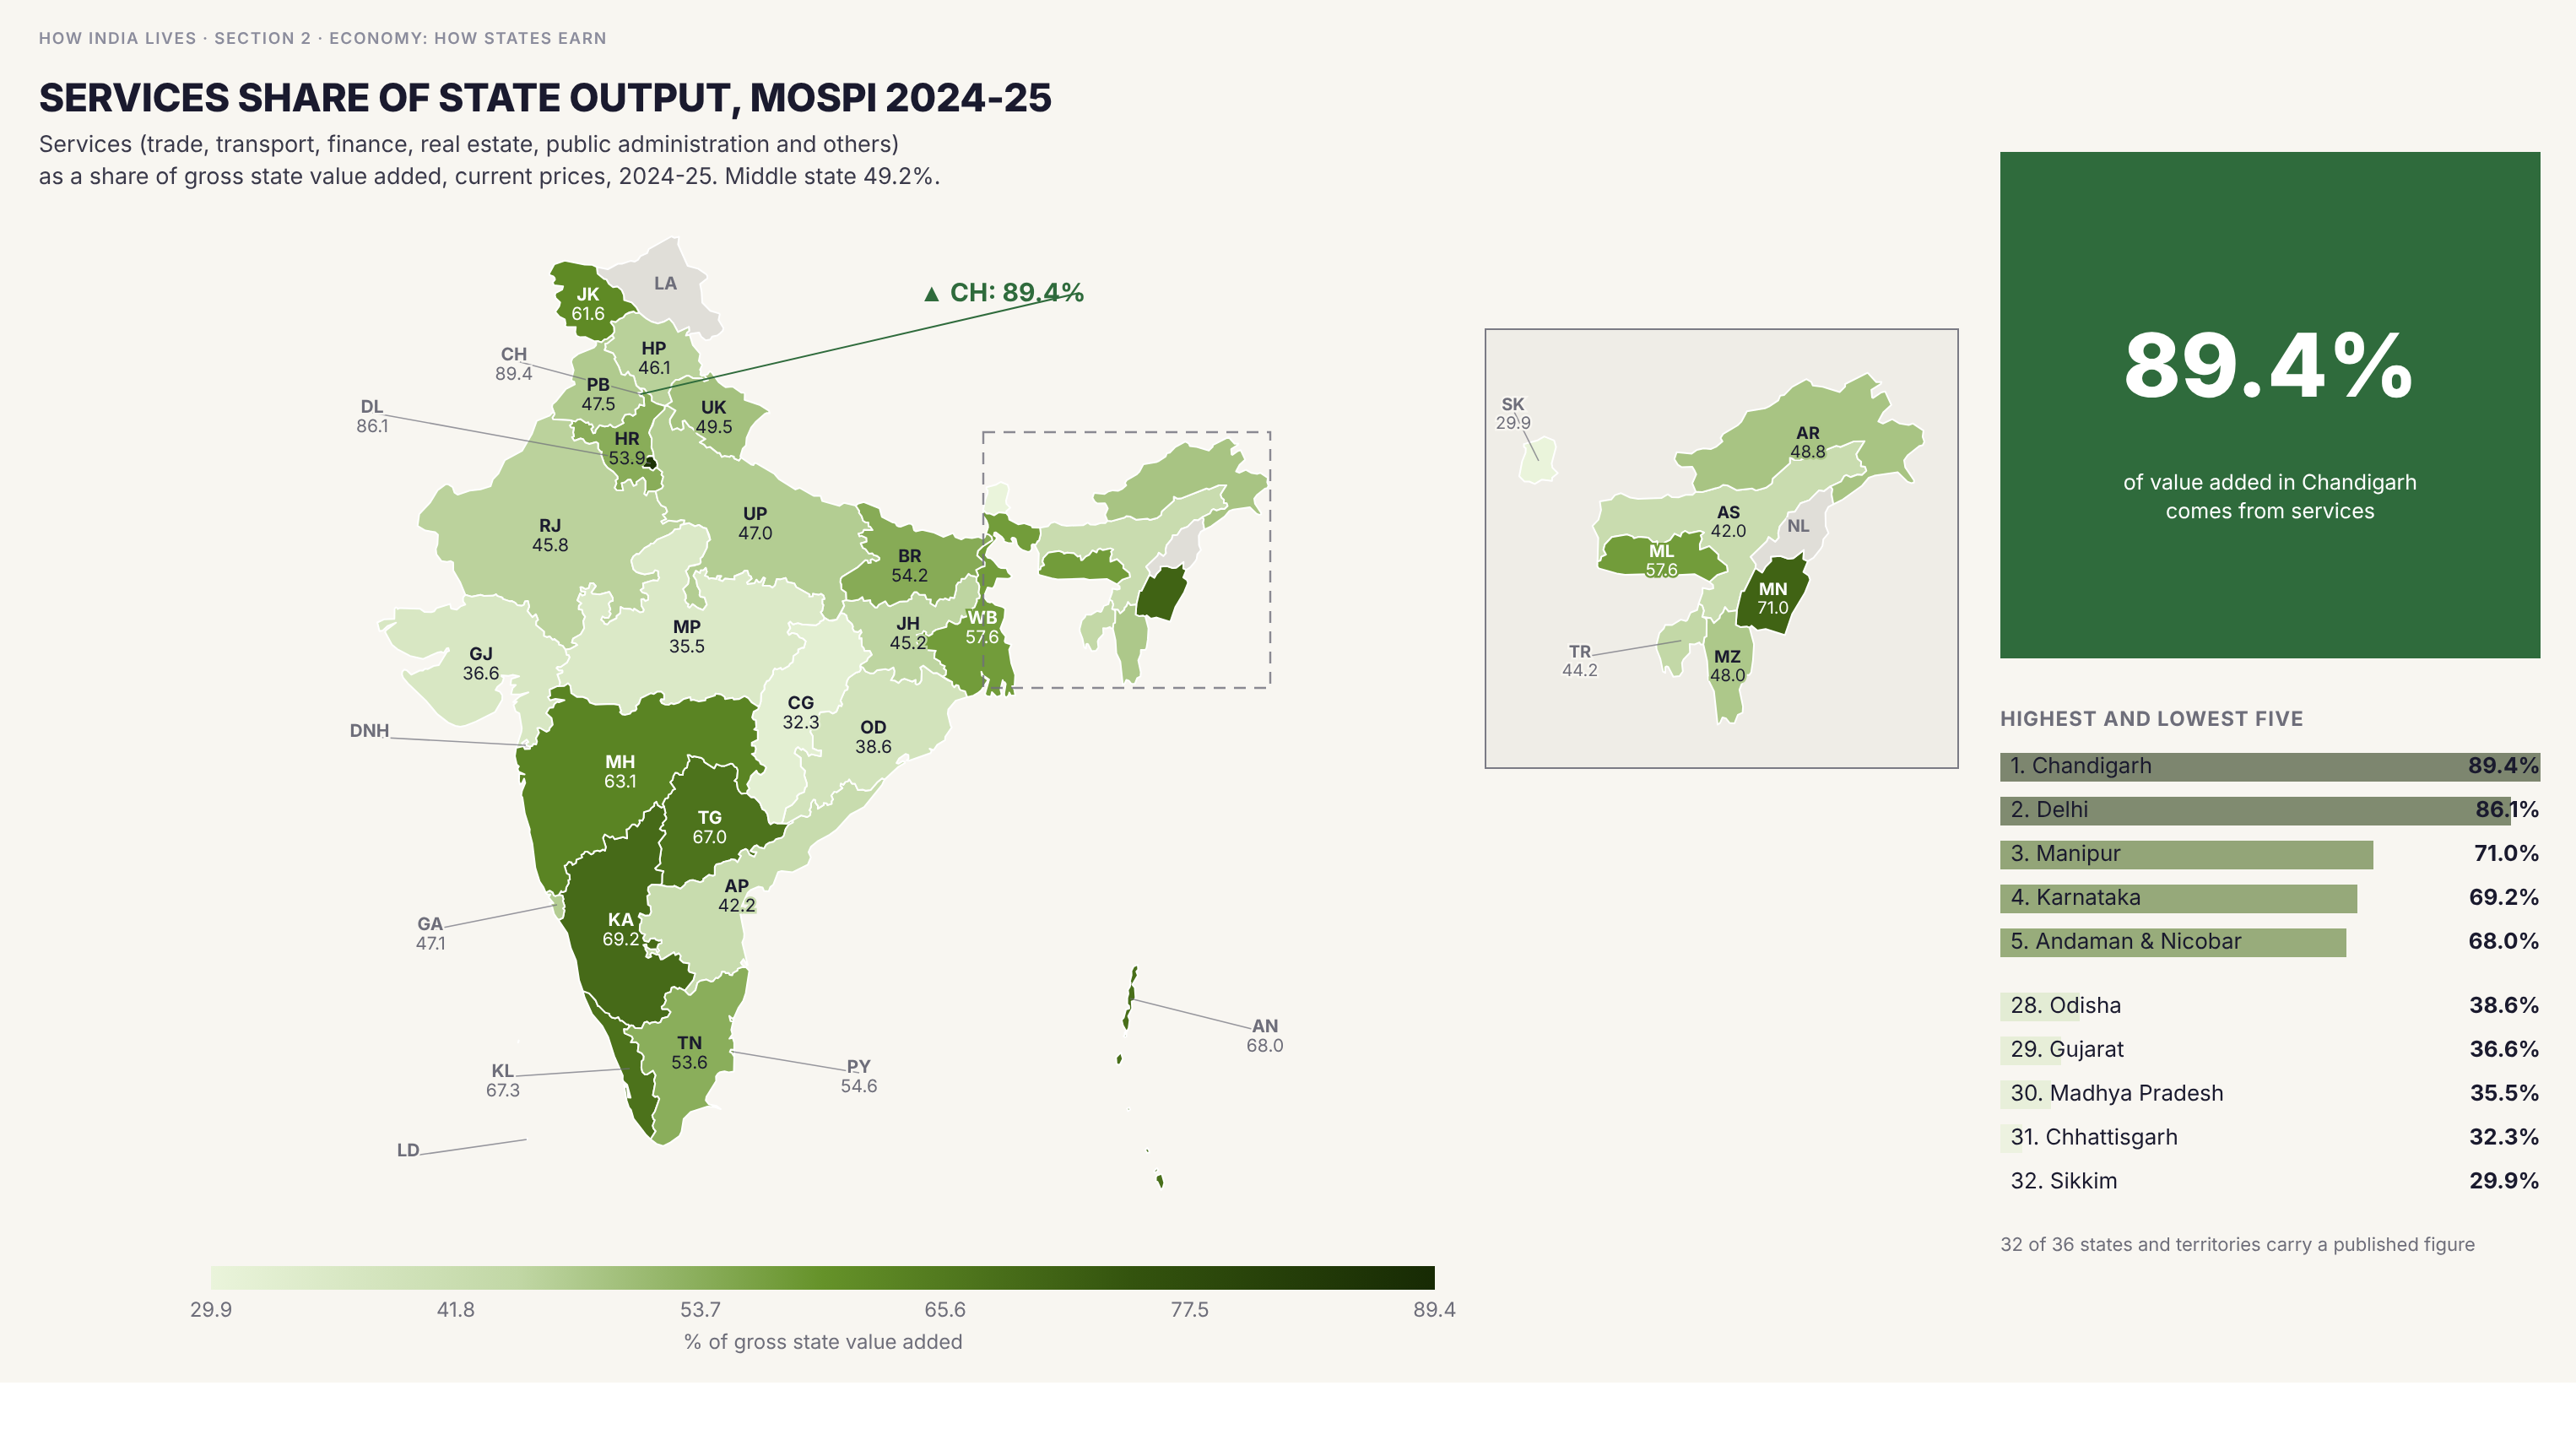
Services are 89.4% of Chandigarh's output and 86.1% of Delhi's, and 69.2% of Karnataka's. They are 35.5% in Madhya Pradesh, 32.3% in Chhattisgarh and 29.9% in Sikkim. The middle state is at 49.2%.
Policy implication
Services here include public administration and real estate, which includes the imputed rent of owner-occupied homes, so a high share does not mean a state sells software or finance. Mining, electricity and construction are counted outside services.
Services here include public administration and real estate, which includes the imputed rent of owner-occupied homes, so a high share does not mean a state sells software or finance. Mining, electricity and construction are counted outside services.
Data vintage. The figures are for 2024-25 and have not been refreshed since this map was made.
Source: MoSPI (National Accounts) (2024-25). See the methodology for notes and limitations.
Part of ImpactMojo. Maps are pedagogical tools for facilitated discussion, not standalone data references. CC BY-NC-SA 4.0.