Decadal Population Growth Rate 2001-2011
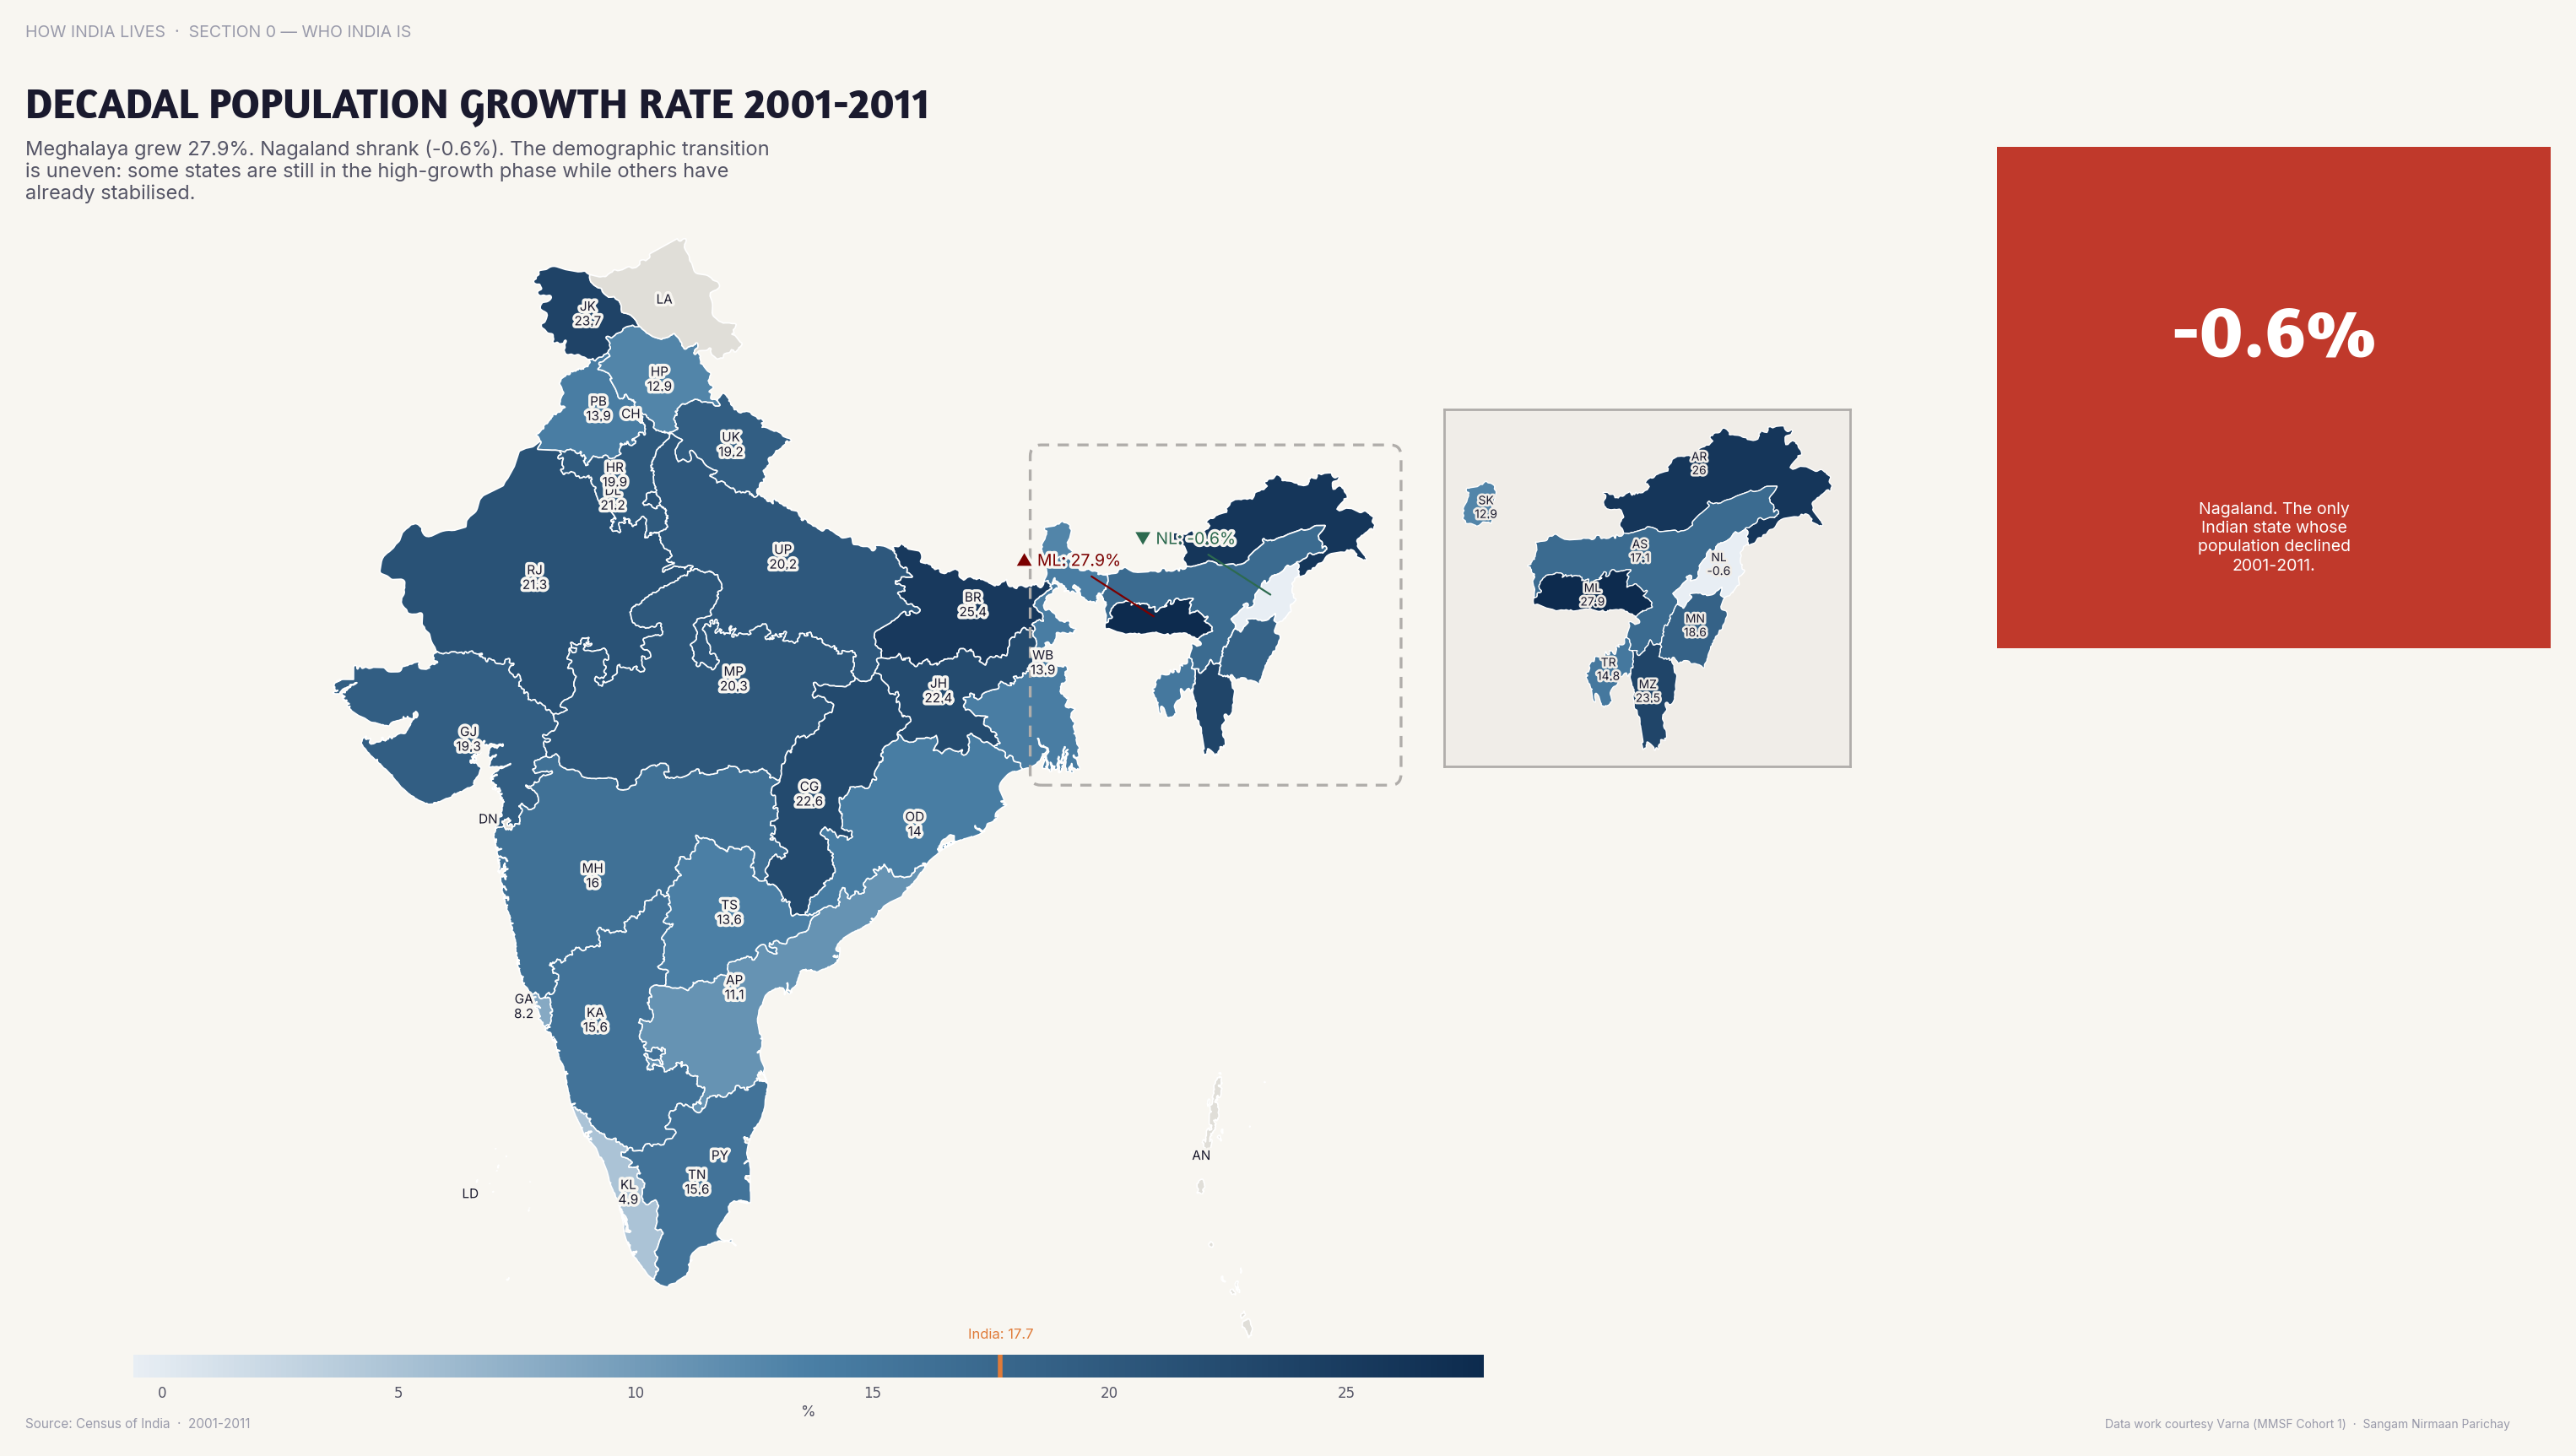
Bihar and Meghalaya grew at 25%+ in 2001-2011; Kerala and Goa at under 5% — India's demographic transition is staggered.
Policy implication
Population growth drives demand for schools, hospitals, and jobs — fast-growing states need fiscal transfers, not blame.
Population growth drives demand for schools, hospitals, and jobs — fast-growing states need fiscal transfers, not blame.
Data vintage. This map uses the 2011 Census, the latest published count by state and district. Populations and shares will have changed since.
Data note. The Census of India is taken once a decade. The 2011 Census is the latest to publish state and district tables, and the next census is planned for 2027, so there is no later official count to replace these figures. Shares, ratios and populations will have moved since 2011.
Source: Census 2011 (2011). See the methodology for notes and limitations.
Part of ImpactMojo. Maps are pedagogical tools for facilitated discussion, not standalone data references. CC BY-NC-SA 4.0.