GSDP Per Capita Rs Lakh
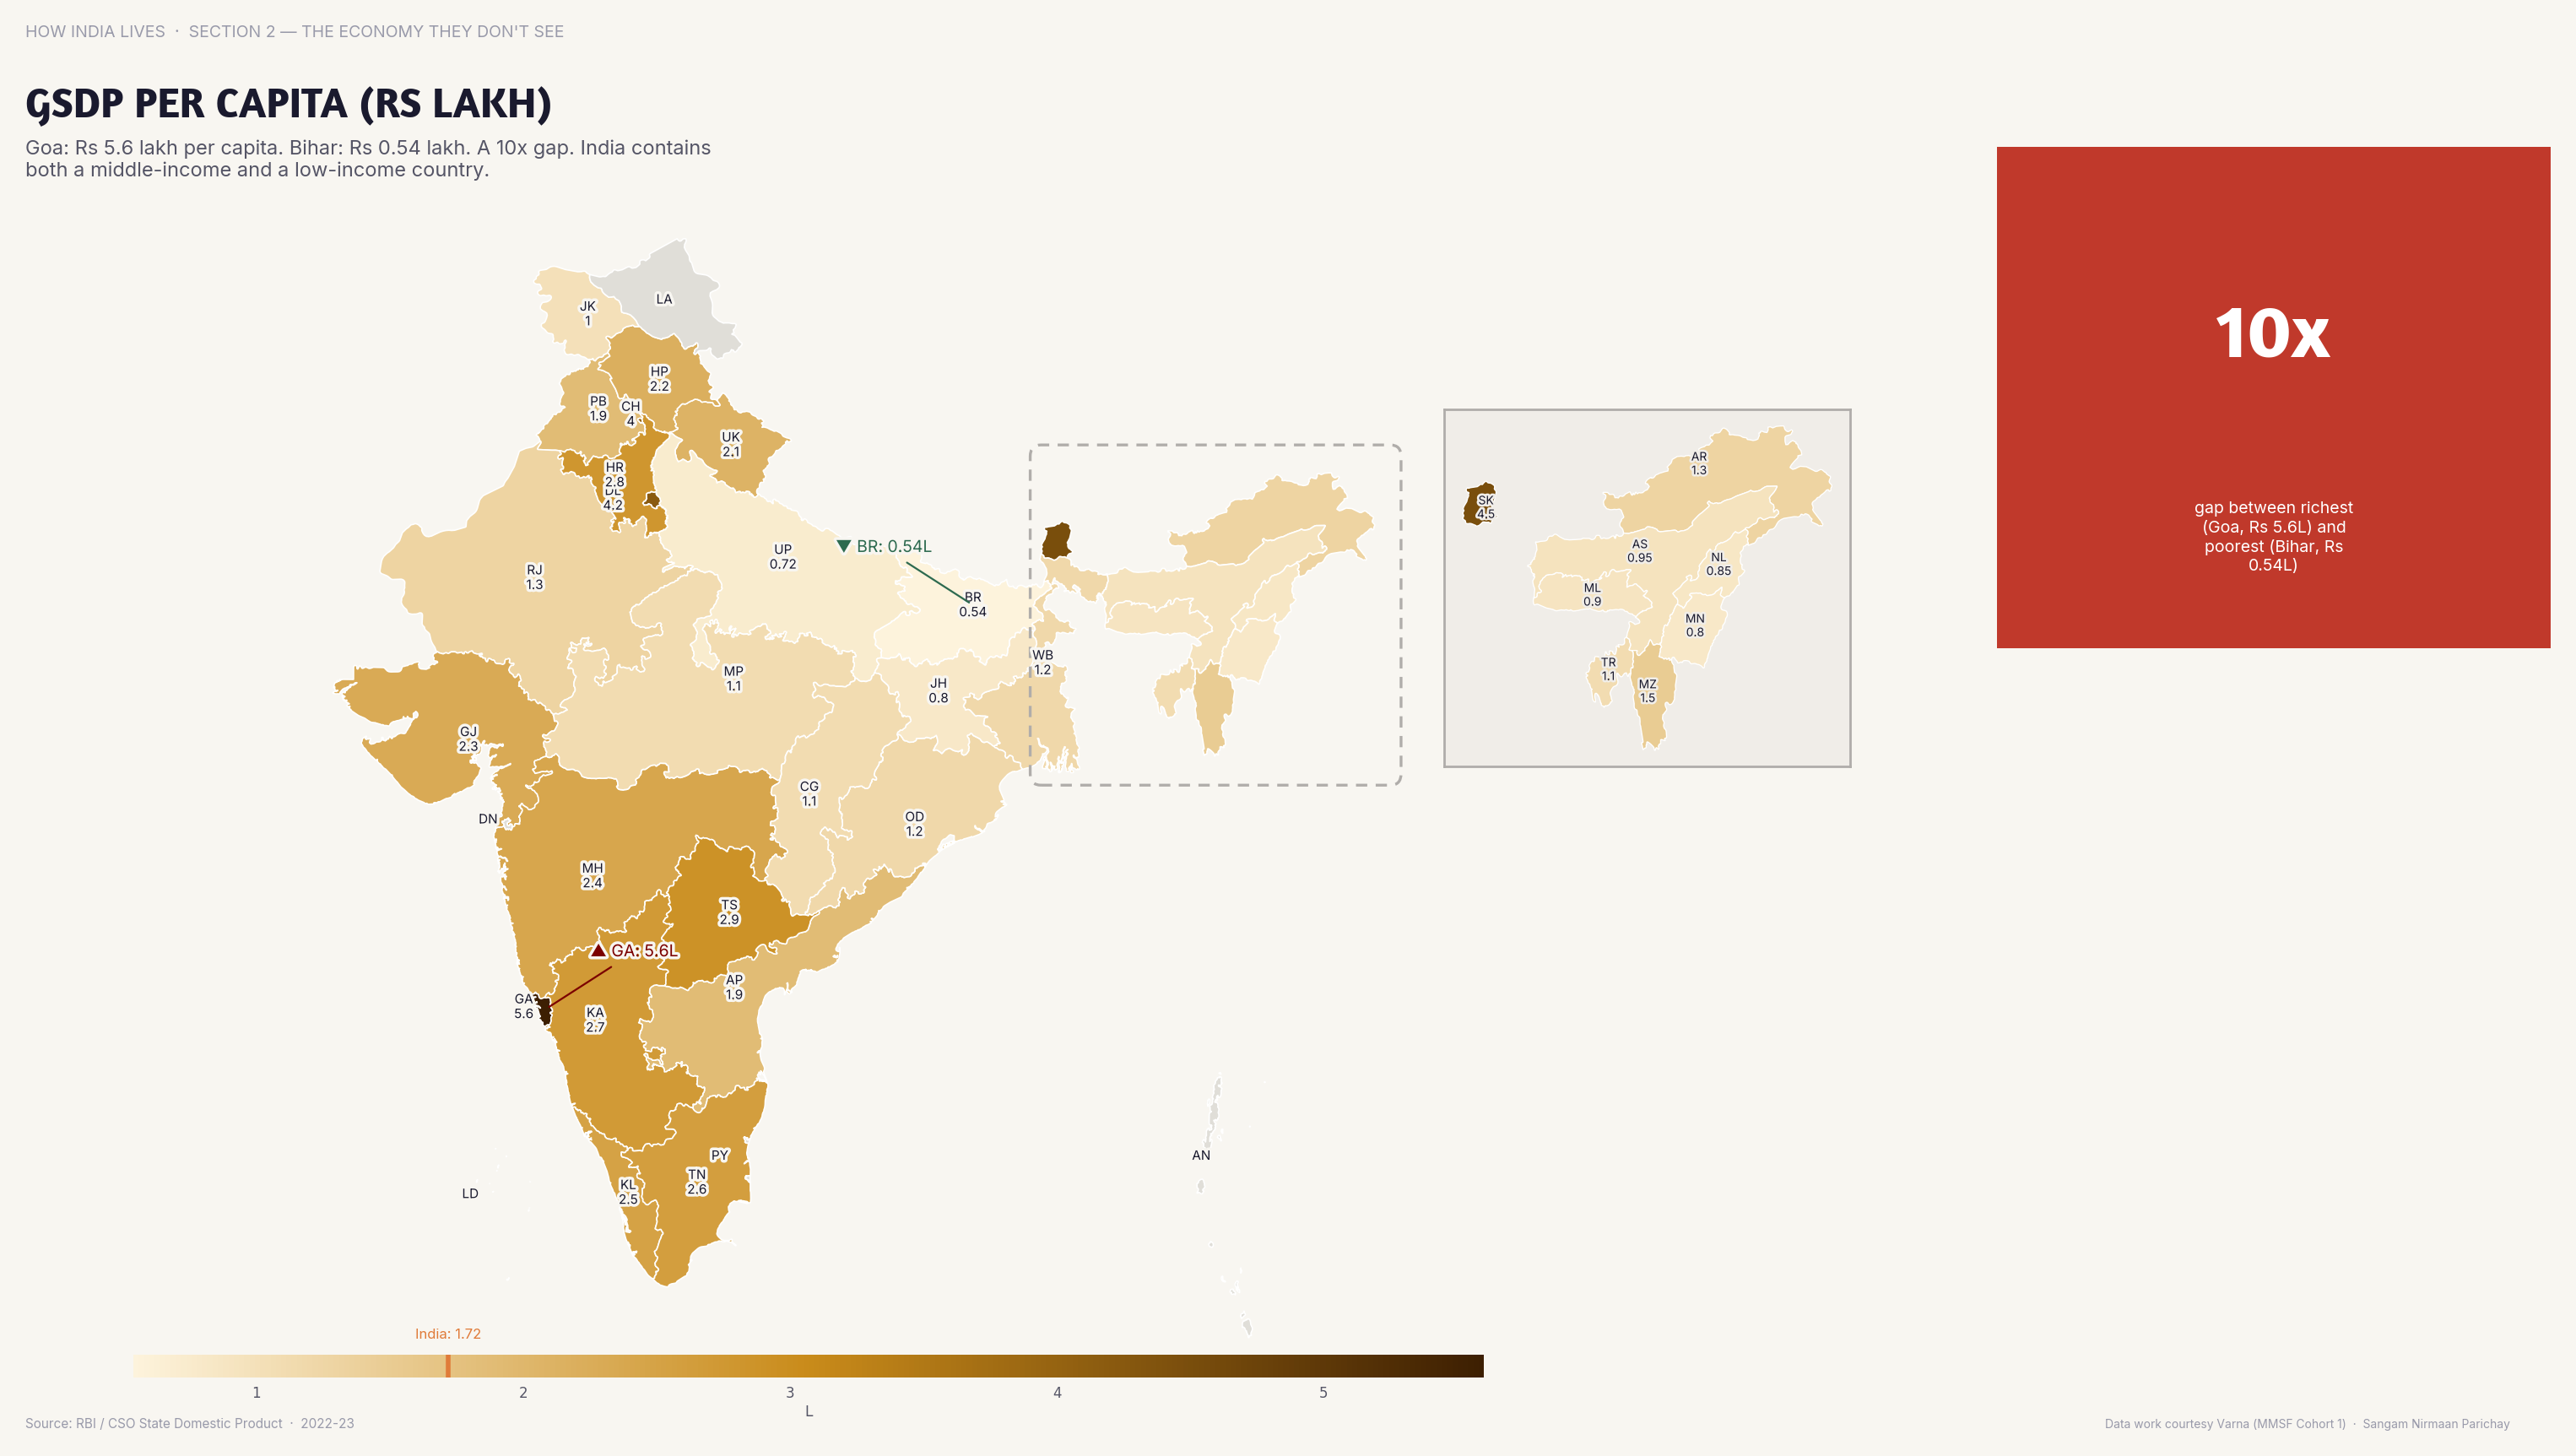
Goa's GSDP per capita is Rs 5.5 lakh; Bihar's is Rs 0.5 lakh — an 11x gap.
Policy implication
Per-capita income gaps between Indian states now exceed gaps between many countries.
Per-capita income gaps between Indian states now exceed gaps between many countries.
Data vintage. The figures are for 2022-23 and have not been refreshed since this map was made. See the newer figures for this measure in the interactive atlas.
Source: RBI/MoSPI (2022-23). See the methodology for notes and limitations.
Part of ImpactMojo. Maps are pedagogical tools for facilitated discussion, not standalone data references. CC BY-NC-SA 4.0.